
A small environmental non-profit wants to keep an eye on the planned path of a pipeline, so they'll know when construction starts on various bits, to ensure that the work can be monitored for compliance with environmental regulations.
What satellite imagery provider or reseller would be right for that?

@waldoj how wide / visible is pipeline construction?
@migurski The easement is 125 feet in width during construction, narrowing to 50 feet post-construction. So a ~30-meter swath will be cut through forest, with temporary road construction, tearing up of the ground, etc., so I think it should be pretty visible.
@waldoj that’s maybe big enough for Landsat? https://landsat.gsfc.nasa.gov/satellites/landsat-9/landsat-9-overview/ I think this imagery is all free but I’ve not personally investigated
@migurski Great idea! I'll have to ask them whether Landsat's 16-day update frequency is often enough for them. If so, it's hard to beat free. :)
@waldoj You’ve got me curious so I’m going to try downloading and displaying some; never worked with this dataset in earnest before
@migurski Me neither! I didn't know that each image covered such an enormous area.
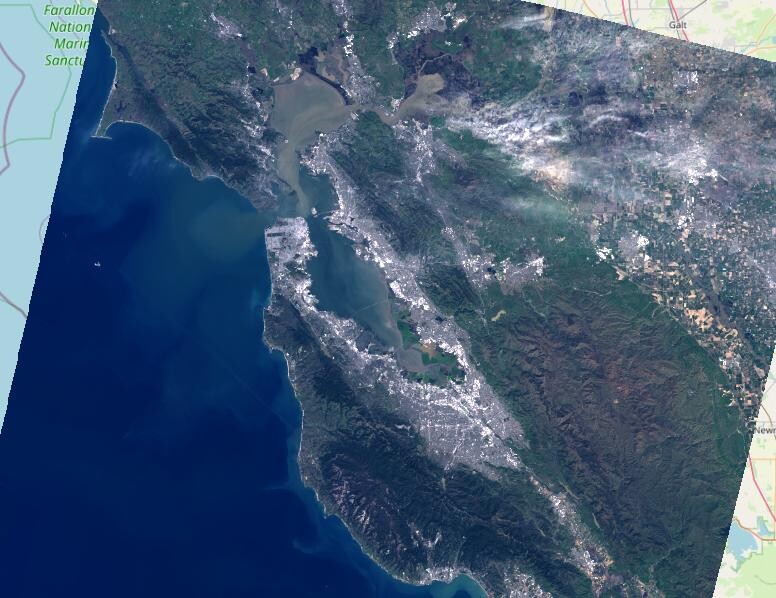
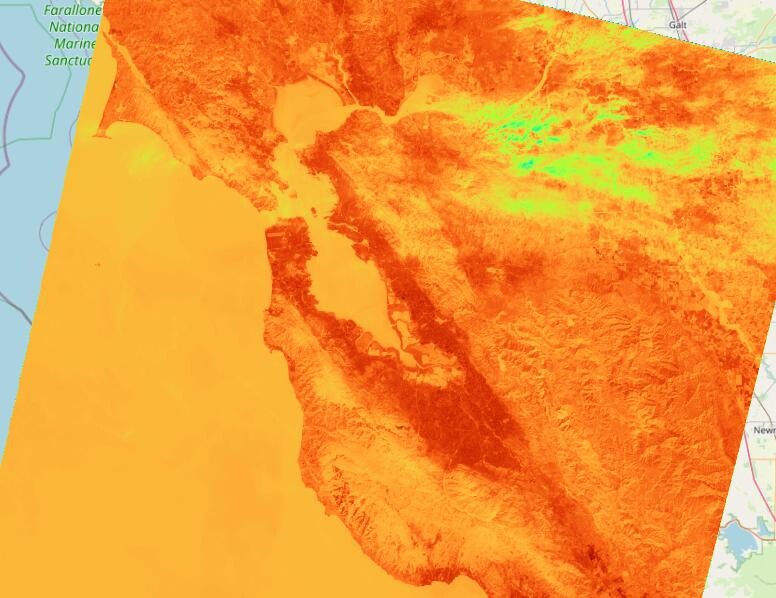
@waldoj Yeah, and they look pretty great! Here’s downtown Oakland from two days ago, a composite RGB image of their 4/3/2 bands plus a false-color thermal image. Maybe that’s useful enough for this purpose?
@migurski The process of retrieving data & knowing when it's been updated might be over their heads, but I'm not sure! “It's free and you can download it yourself" might be a compelling enough argument for them to figure it out. Thanks!
@waldoj I can record a screen video if it would be helpful?
@migurski That's a very kind offer (and also a good idea)! If a screencast will help them, I'll put one together. It'd sure be easier than re-explaining every week, indefinitely. :)

@vruba @migurski @waldoj Direct link, if you want to try it out https://apps.sentinel-hub.com/eo-browser/?zoom=15&lat=37.32042&lng=-80.41085&themeId=DEFAULT-THEME&visualizationUrl=https%3A%2F%2Fservices.sentinel-hub.com%2Fogc%2Fwms%2Fbd86bcc0-f318-402b-a145-015f85b9427e&datasetId=S2L2A&fromTime=2018-03-18T00%3A00%3A00.000Z&toTime=2018-03-18T23%3A59%3A59.999Z&layerId=2_FALSE_COLOR&demSource3D=%22MAPZEN%22
@kgjenkins @vruba @migurski Whoa, that’s impressive!
@waldoj @kgjenkins @migurski (E-mail or whatever if I can be of use, but it looks like you’ve got this.)
@kgjenkins @vruba @migurski Wow, this is really impressive. The time lapse visualization is great. The folks at this small non-profit aren't particularly technical, so this easy-to-use viewer is a big help for putting this imagery to work. Thanks!

@vruba @migurski @waldoj +1 to Sentinel-2 -- it has 10m resolution for RGB and IR bands, plus updates every few days. The EOBrowser website makes it pretty easy to view various band combinations that help highlight things like pipeline construction. For example, here's it showing a pipeline route that didn't exist 2 weeks earlier.