Ingrid Burrington @ingrid@everything.happens.horse
- pronouns
- any
- web page
- http://lifewinning.com
- a little newsletter
- https://buttondown.email/perfectsentences
Admin
Joined Sep 2020
Networks of New York layouts in progress, having a lot of fun with this but need to decide how consistently to apply the collage-y textures alongside more flat color bars
Another one, I think this is getting closer? For reference the book will be pocket size, 4x6in
more iterating on the Networks of New York 2026 cover
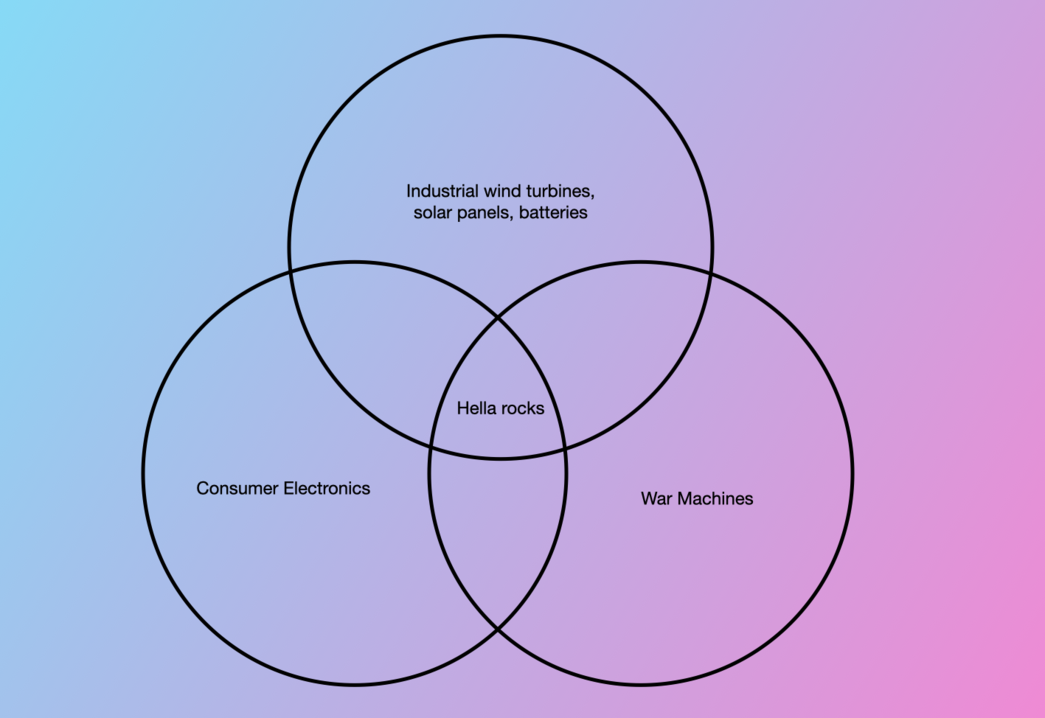
Trying out some things for the 2026 Networks of New York layout
I myself am a bit of a mysterious force that has a magnetic personality
(the photo in question, which escaped containment at some point and sometimes people will be surprised to learn that I was the originator of it
love finding reports on military logistics from the 1990s holy shit
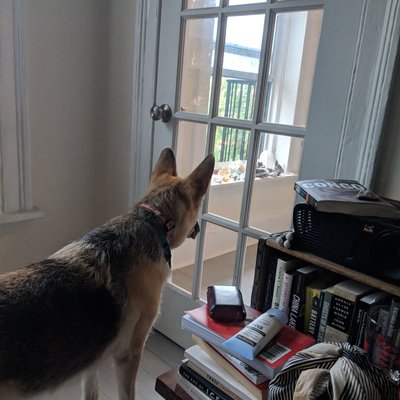
I had to break the news of Kitty's death to a guy who knew her from the dog park today, hadn't seen him in a while, and it's sort of left me intermittently weepy all day
This is a picture of her from two years ago today, I miss her so much
working on this episode of RIP Corp is fucking up my blood pressure so bad
Working on some plotter drawings on vintage tracing paper and oh no do I have to make light boxes for these it looks really cool
a humiliatingly precise depiction of me from a documentary interview I did last week
Because I have so little money right now and museums are expensive my day off in Vancouver was seeing Pixel Orca and from a distance the container port
- pronouns
- any
- web page
- http://lifewinning.com
- a little newsletter
- https://buttondown.email/perfectsentences
Admin
Joined Sep 2020