
The answers to your questions are:
1. Yacht and rally car races.
2. Yes, well noticed! We call it “Null Island”.
3. No, but it would be nice if it were practical.
4. People scraping tiles.
5. Yes, because the distribution of traffic follows Zipf’s law.
6. If I have time.
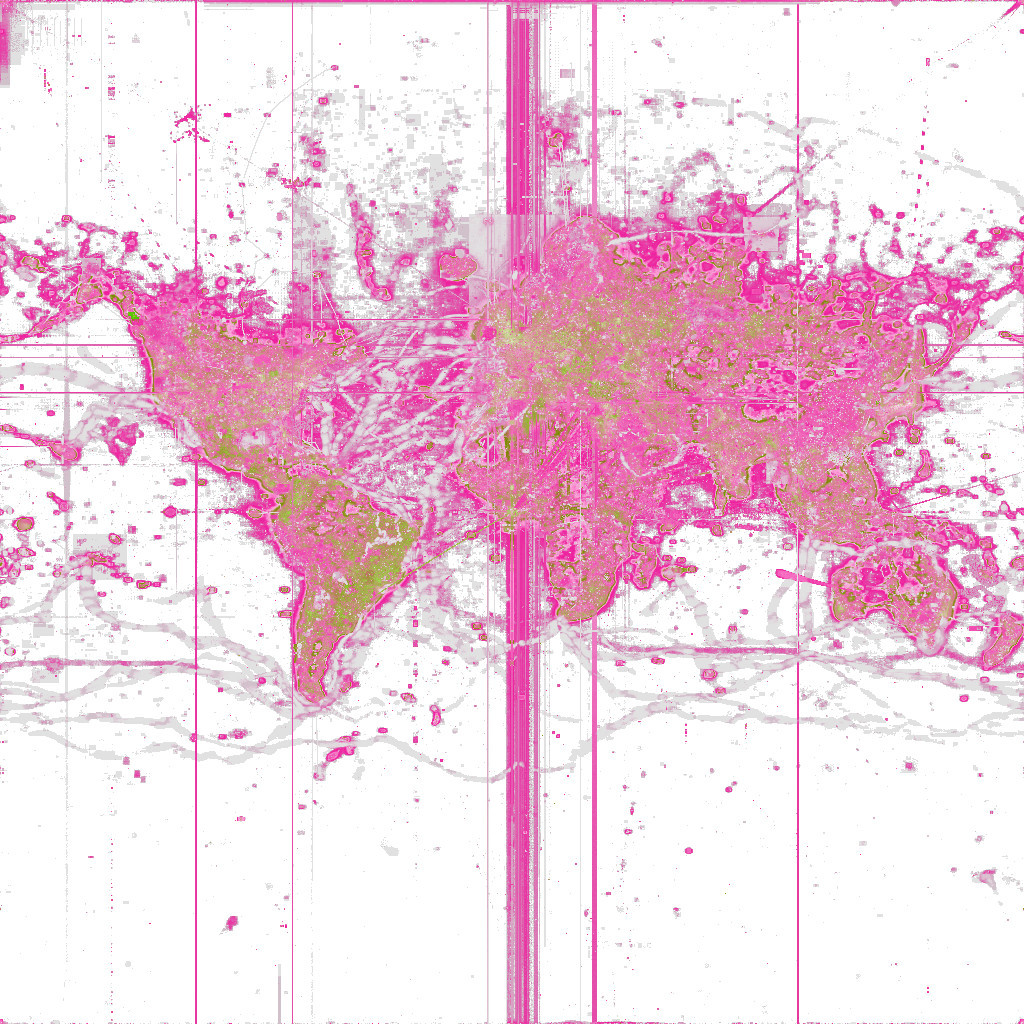
Same general idea and source data, but this time it’s just z-score (https://en.wikipedia.org/wiki/Standard_score), with red positive and green negative. Hard to say that this makes it easier to spot the interesting anomalies, but it seemed like the common sense thing to try. You can see the the OceanGate incident, the earthquake in Turkey and Syria, probably some festivals, etc.
Ideally you’d have this over a basemap and with both dimensions (number of views and view anomaly) visible, but I will generously allow someone else to worry about that.
Okay, fine, @jonty cajoled me into it. Lighter is more traffic; warmer is more positive anomaly for the day.
Now, certain nerds and haters might squint at this and say “It looks like you did this in oklab color space and then tried to half-ass some gamut mapping when you remembered that a lot of the highest z scores are in places with very low traffic counts!” and I would rebut that in scrupulous detail with one simple argument: Good night.

@vruba I like it! I love happy accidents like this and the palette is remarkable.

@vruba Juuuuuuuuust right.


@vruba Spectacular work

@vruba I mean I was going to say, (I wasn't but it's fun to think I could've if I knew how, so I'll just say, wow! cool!).

@vruba I like the rays fanning out from null island that are likely leaflet panning to the desired location.

@vruba Yep those are my questions!

@vruba I can guess the questions for the first four answers, but…
@mirabilos “Are the tile counts nonlinearly scaled for coloring?” and “Why don’t you try [something else]?”
@vruba thanks, this even got me into learning about Zipf’s law a bit.

Woops, the tag didn’t work in the original post. Credit to @pnorman for the idea.