Inspired by @pnorman’s animation, here’s a year of daily OpenStreetMap tile traffic. One frame per UTC day, from the start of September 2022 through end of August 2023. It’s from the public log aggregates, so some low-traffic tiles are left out for (I assume) efficiency and privacy.
The answers to your questions are:
1. Yacht and rally car races.
2. Yes, well noticed! We call it “Null Island”.
3. No, but it would be nice if it were practical.
4. People scraping tiles.
5. Yes, because the distribution of traffic follows Zipf’s law.
6. If I have time.
Woops, the tag didn’t work in the original post. Credit to @pnorman for the idea.
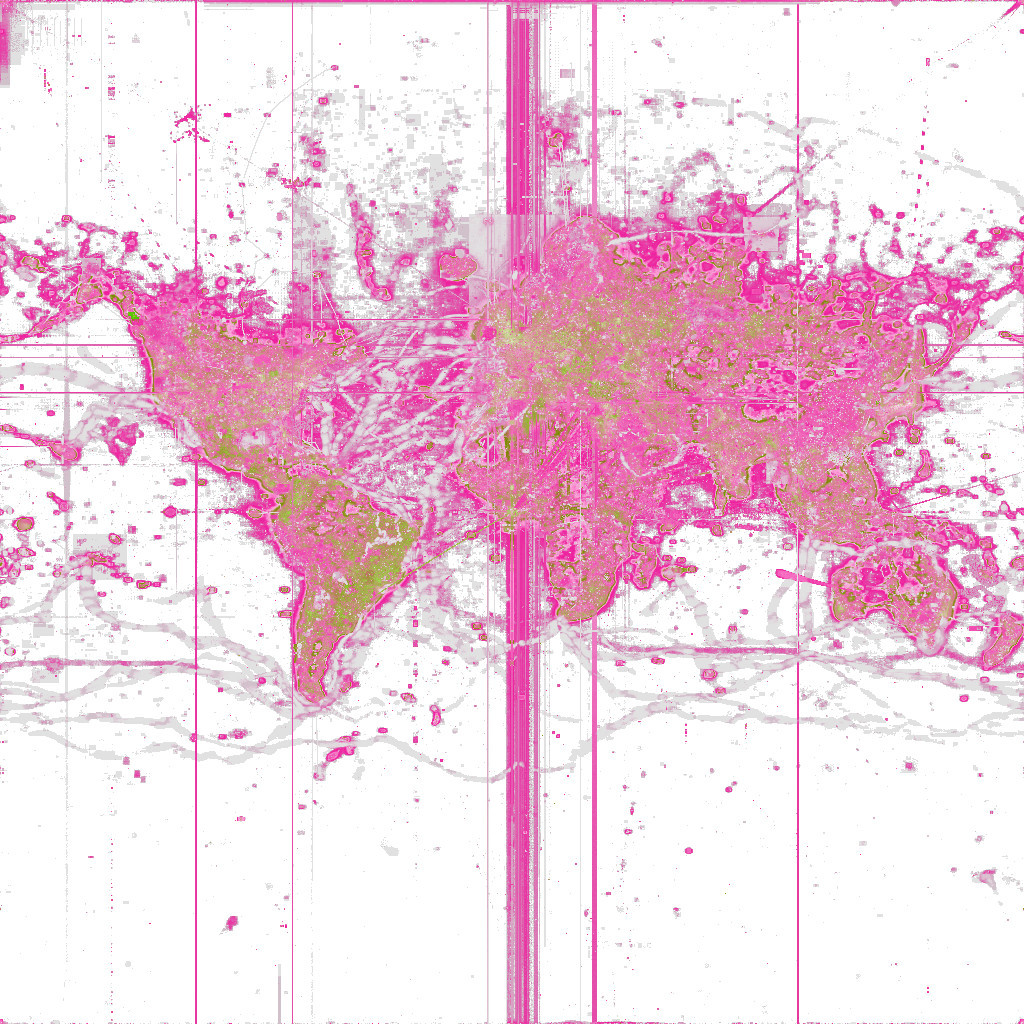
Same general idea and source data, but this time it’s just z-score (https://en.wikipedia.org/wiki/Standard_score), with red positive and green negative. Hard to say that this makes it easier to spot the interesting anomalies, but it seemed like the common sense thing to try. You can see the the OceanGate incident, the earthquake in Turkey and Syria, probably some festivals, etc.

@vruba Juuuuuuuuust right.

@vruba I like it! I love happy accidents like this and the palette is remarkable.