Ingrid Burrington @ingrid@everything.happens.horse
- pronouns
- any
- web page
- http://lifewinning.com
- a little newsletter
- https://buttondown.email/perfectsentences
Admin
Joined Sep 2020
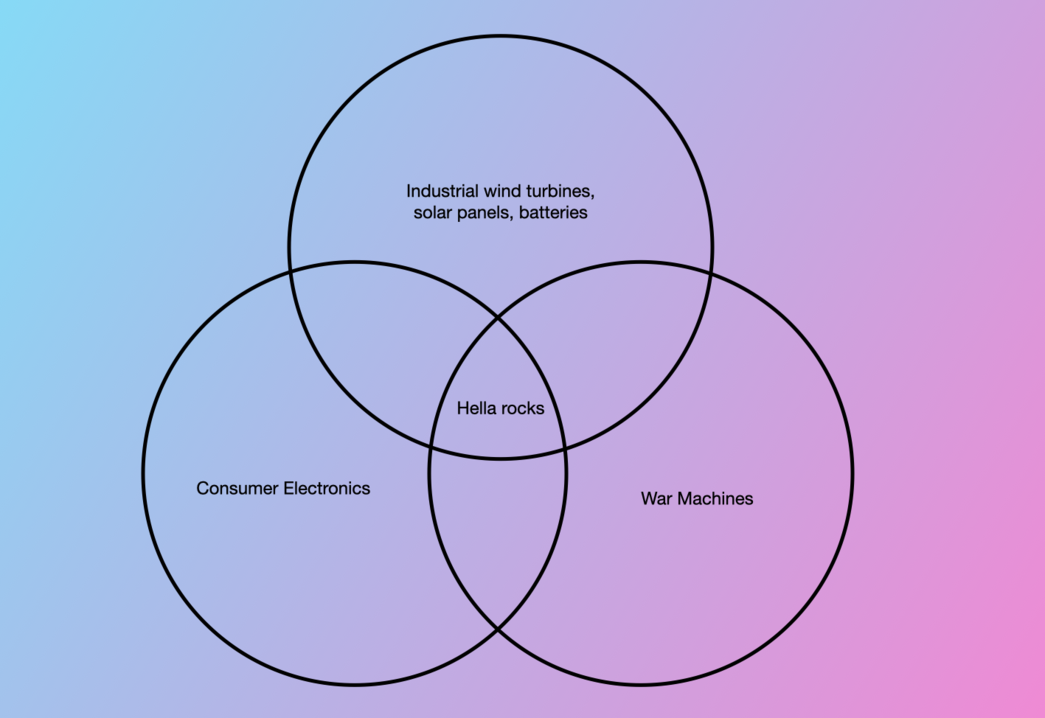
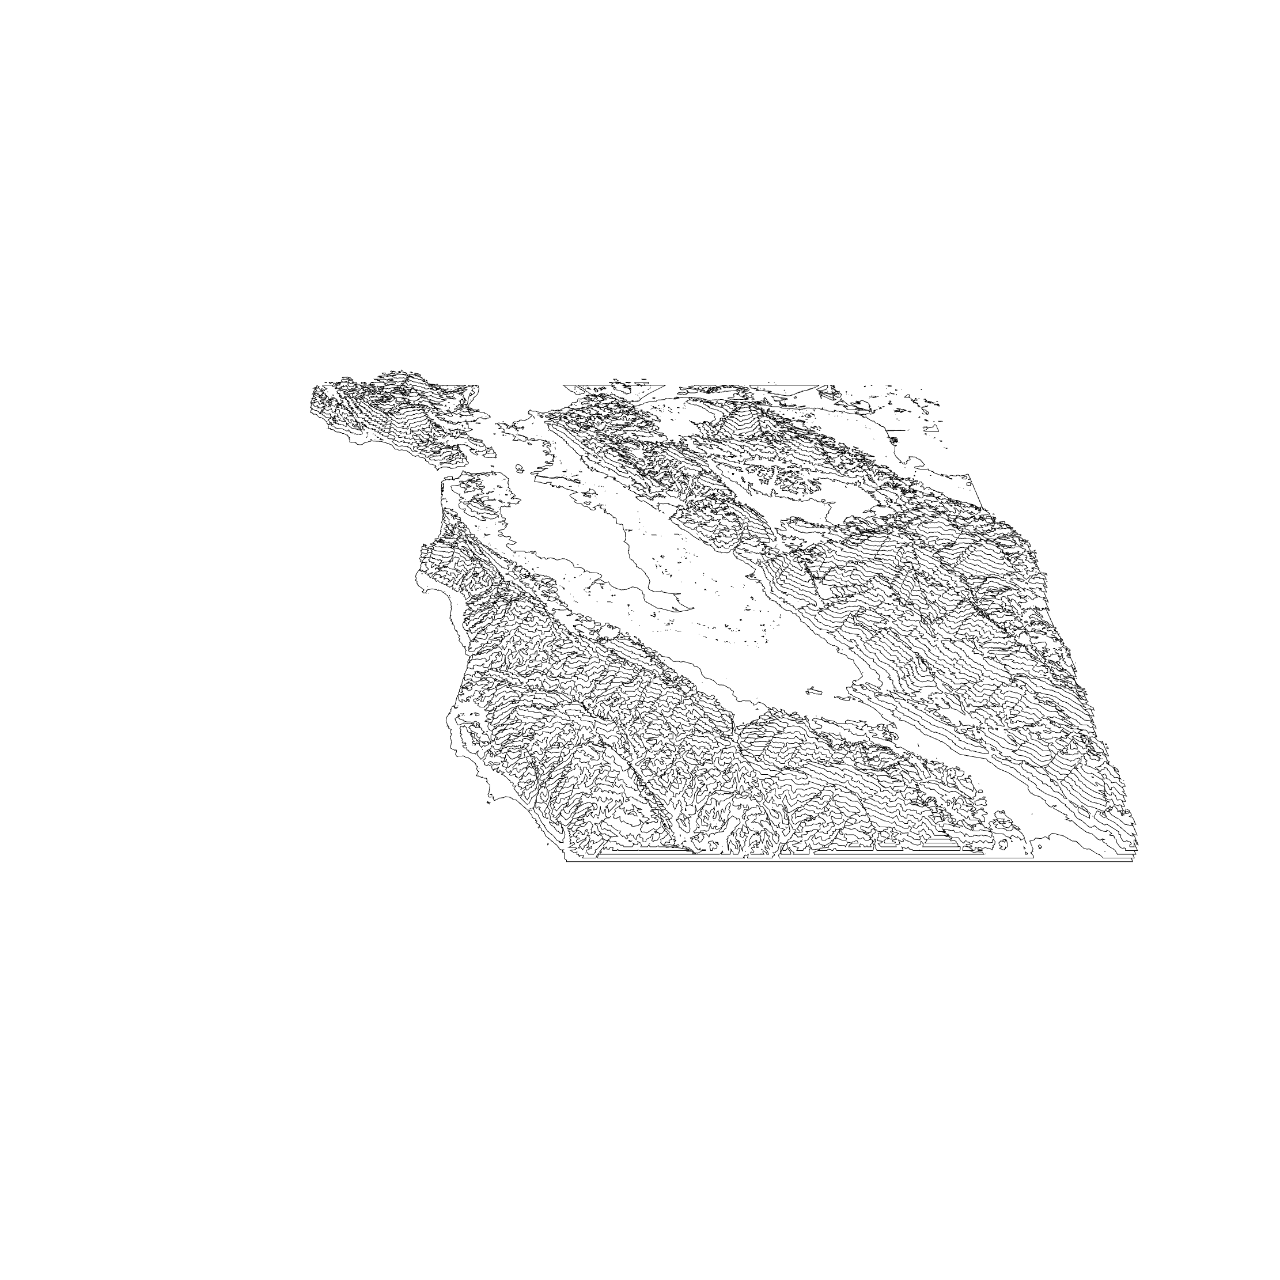
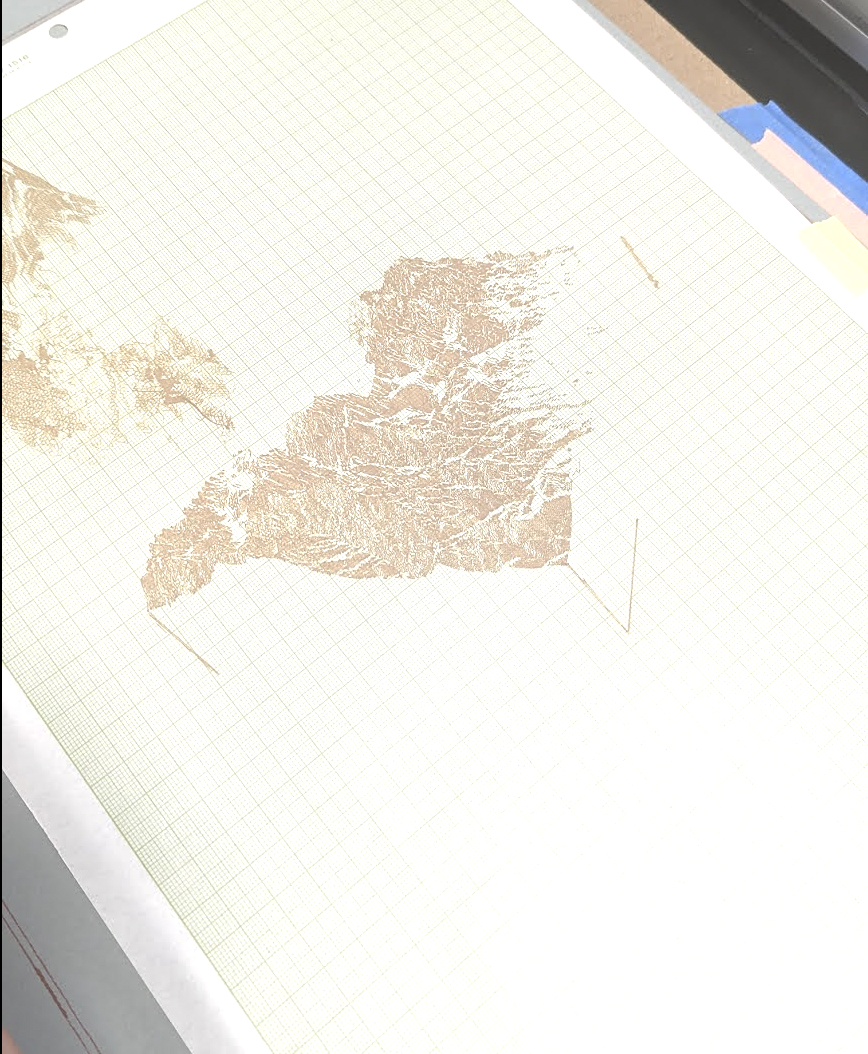
been wanting to make some plotter drawings to raise money for all the gaza gofundmes in my timelines so I started trying out the DEM-to-SVG approach with sentinel-1 data estimates of destroyed areas. Gaza's pretty flat so as terrain it doesn't quite have the same effect but the gaps are still a lot. This is a screenshot from a corner of Khan Younis.
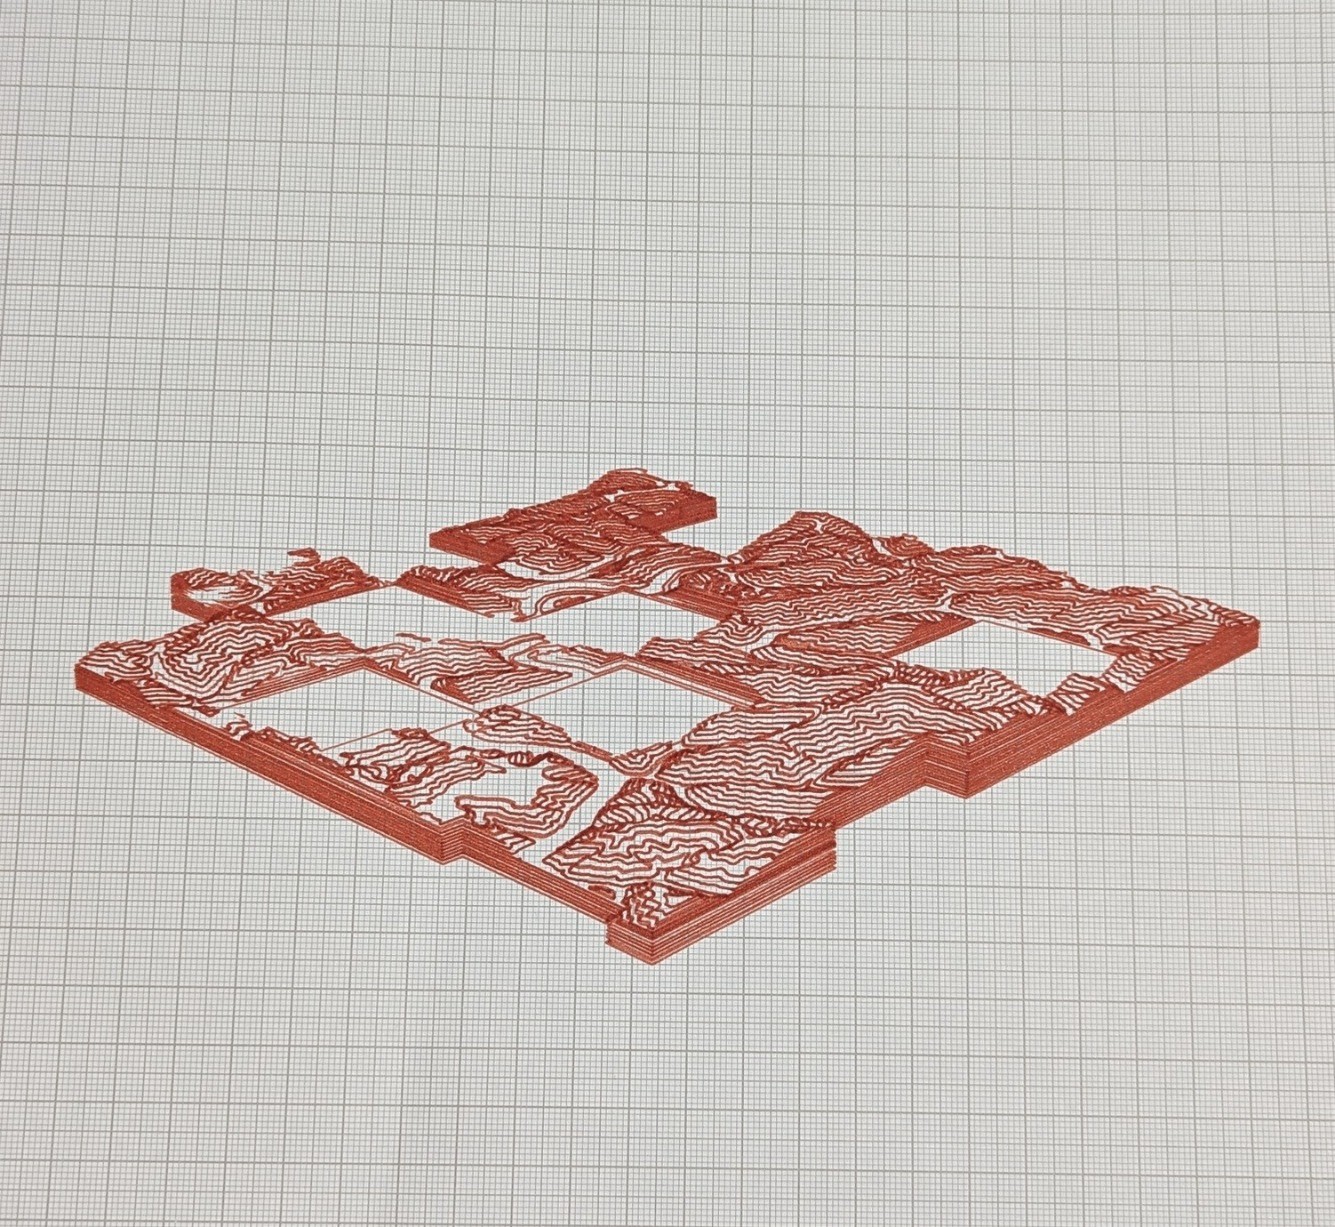
not really sure what the fuck I'm doing here but it looks cool I think? trying to riff on the USGS isometric diagram aesthetic https://socks-studio.com/2023/10/15/the-hidden-territory-usgss-1950s-to-1970s-isometric-geological-diagrams/
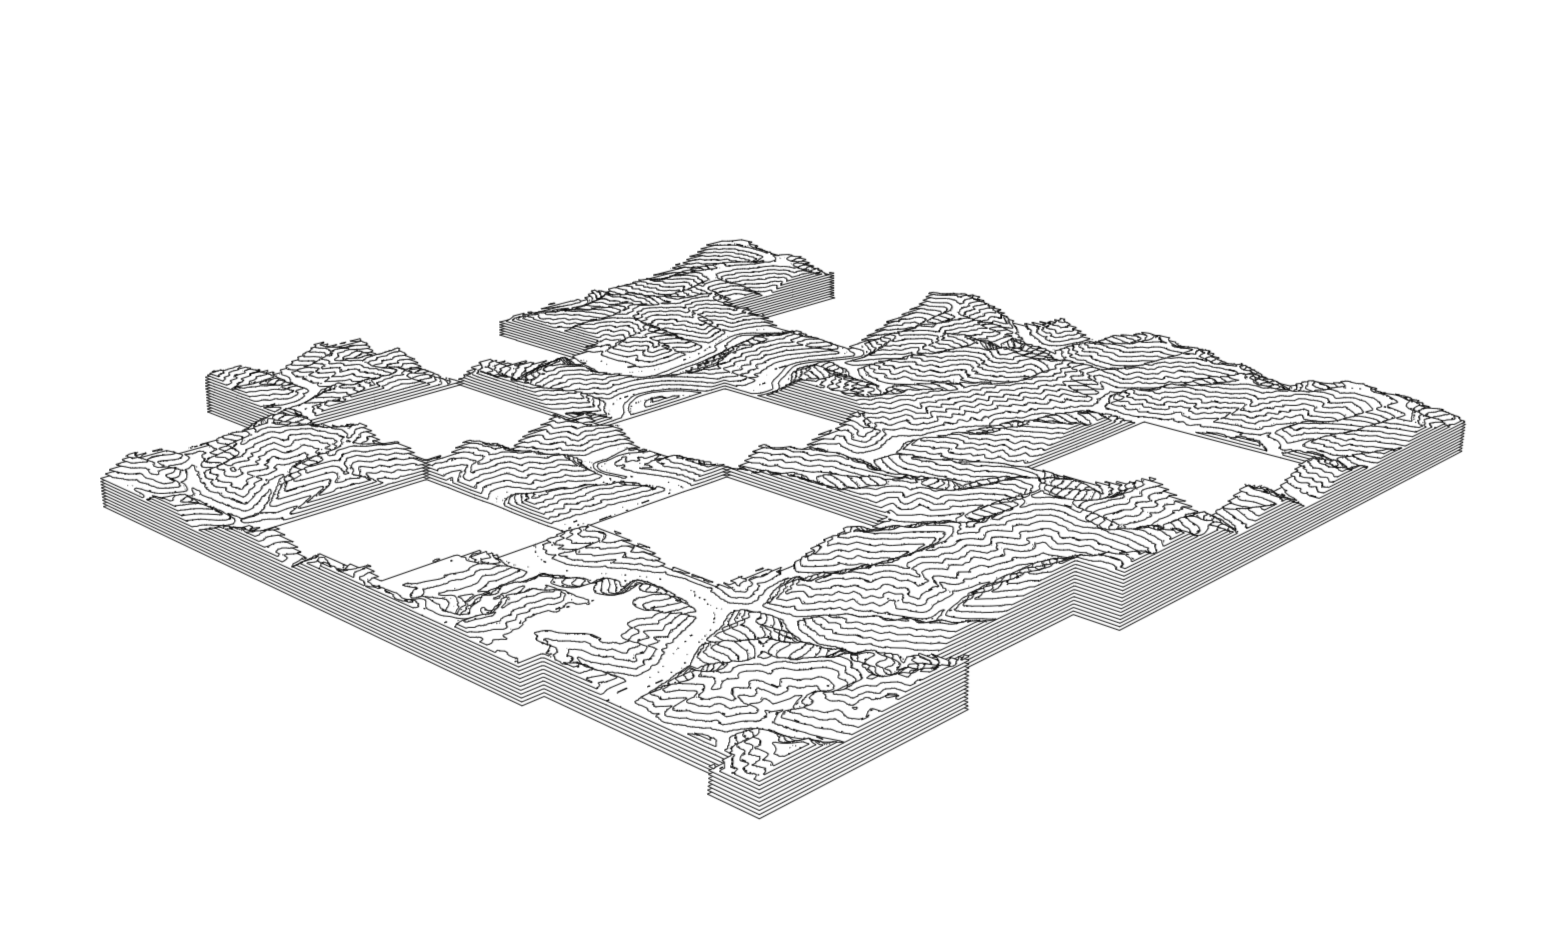
https://observablehq.com/d/c8fafa2b34282fb4 retrofitted an observable demo that did a neat trick with generating isolines to accept arbitrary geojson files--it's hella slow but I think it will make for some nice plotter drawings. this one is probably going to be a little gift for a friend who just had a kid whose middle name is, I am serious, California
testing out a pipeline of STRM data to STL to plotter.vision's SVG renderer, gel pens can be a little hit or miss but overall promising I think?
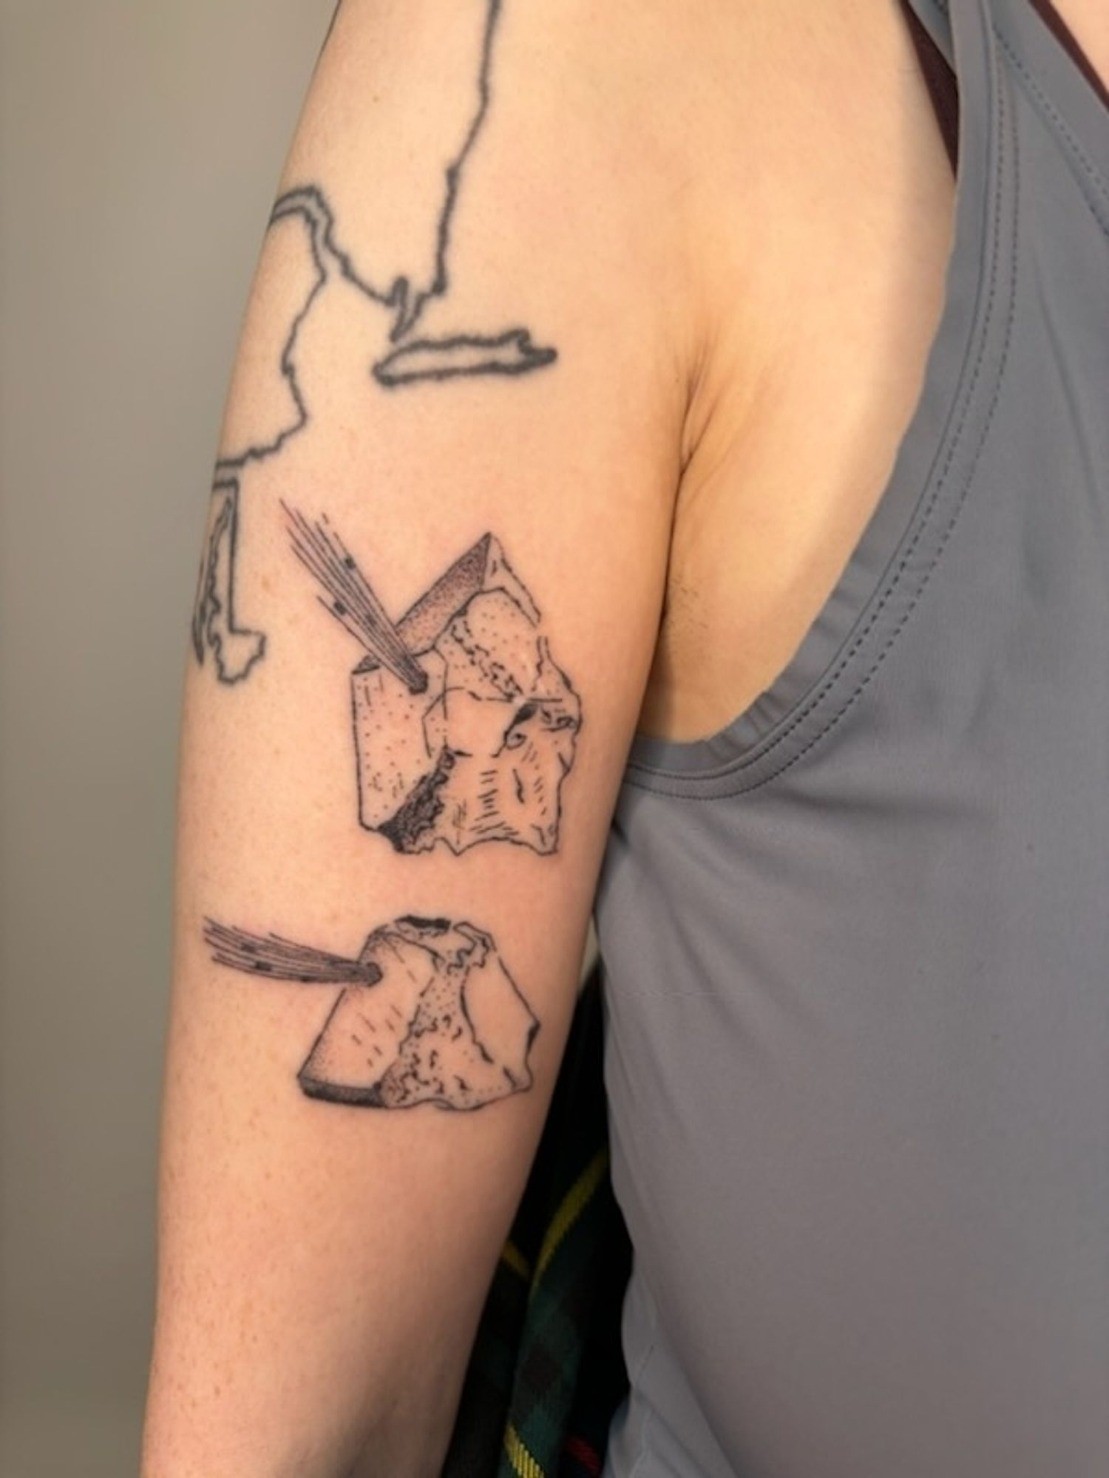
Got a new tattoo because this year has been a lot but I am still alive
It's based on a drawing of a quartz crystal I found in the National Archives when I was researching high purity quartz mining in Brazil during WWII
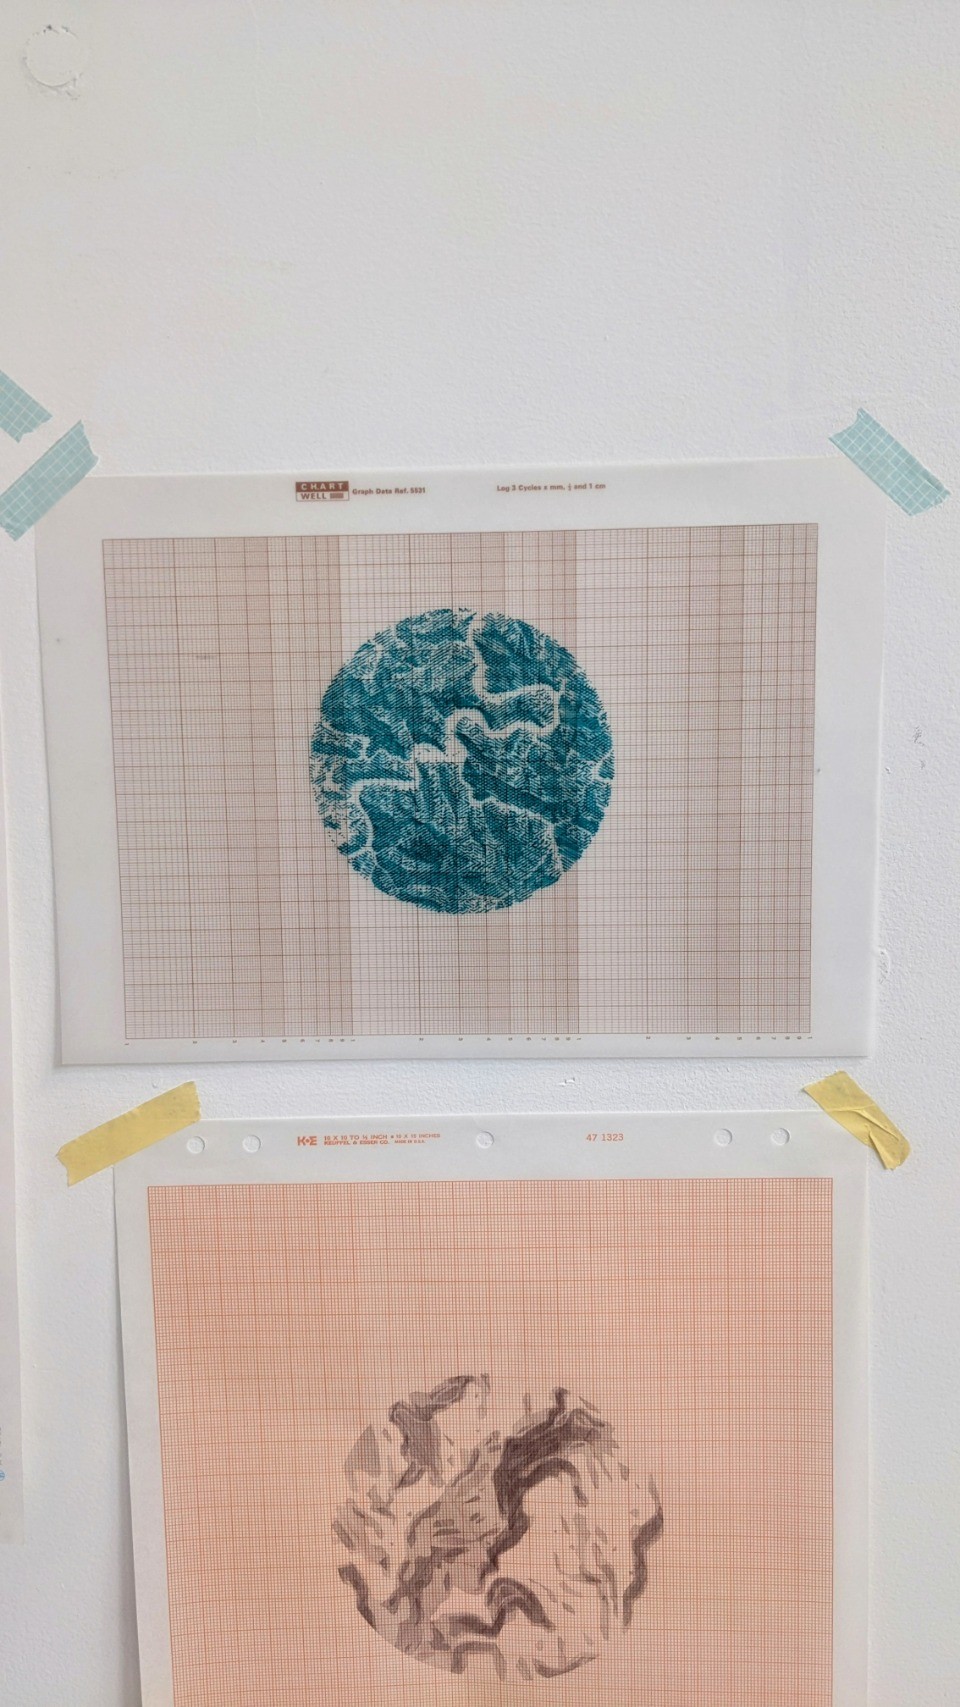
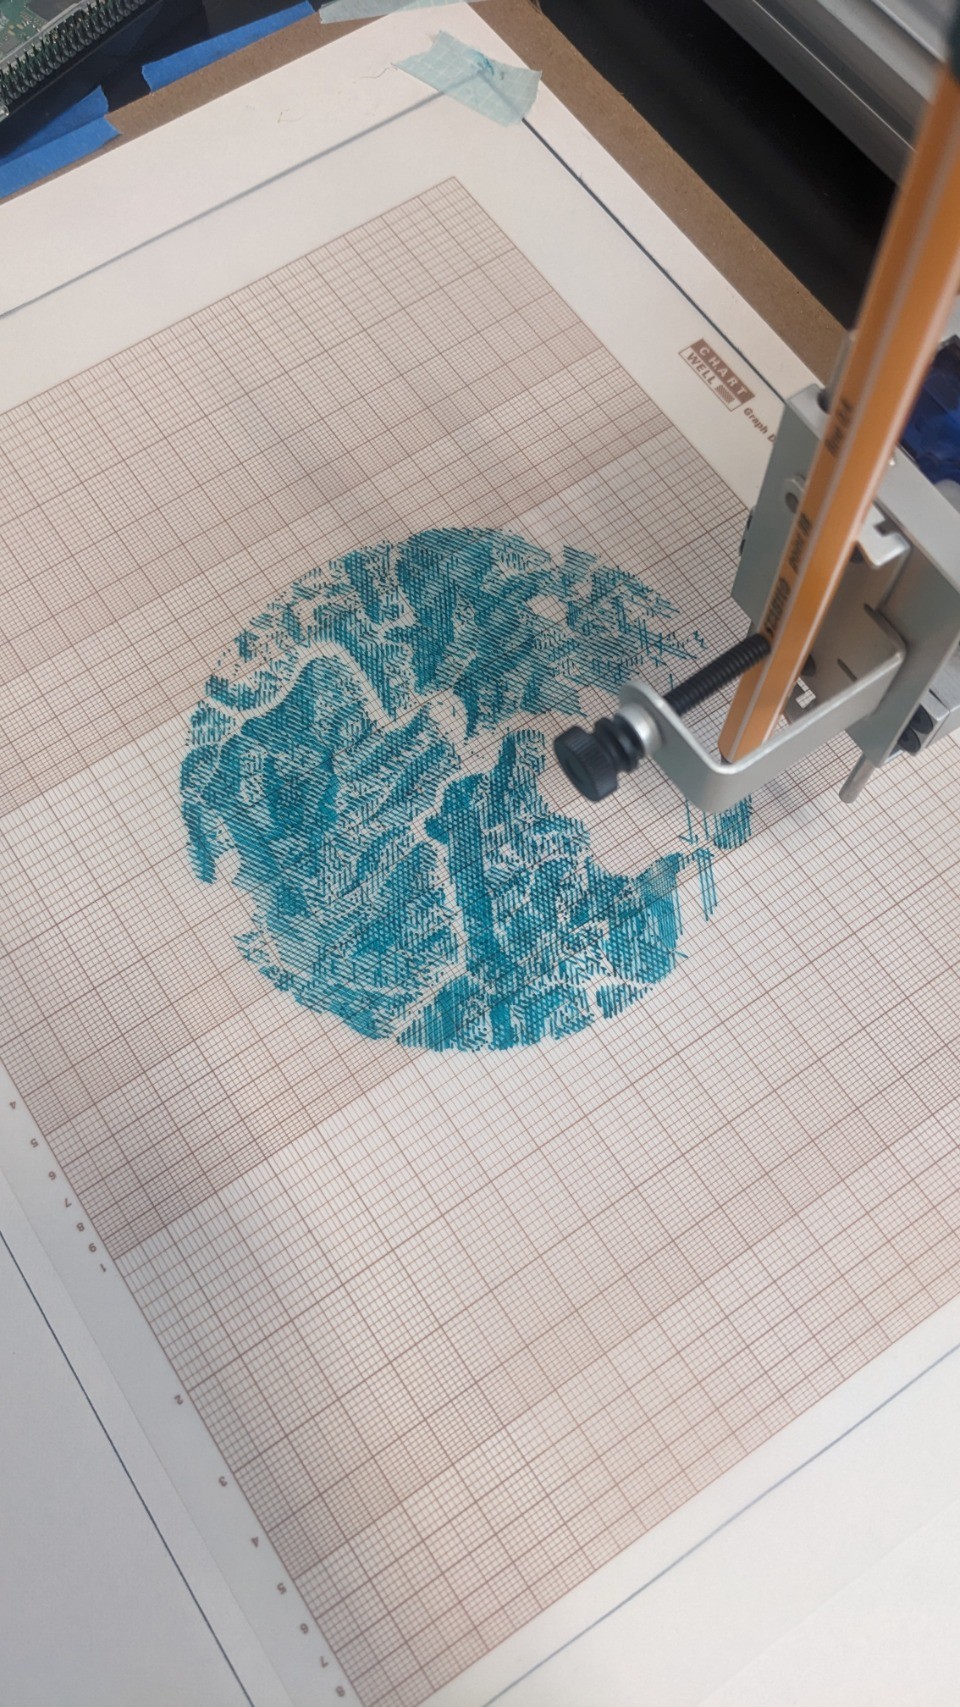
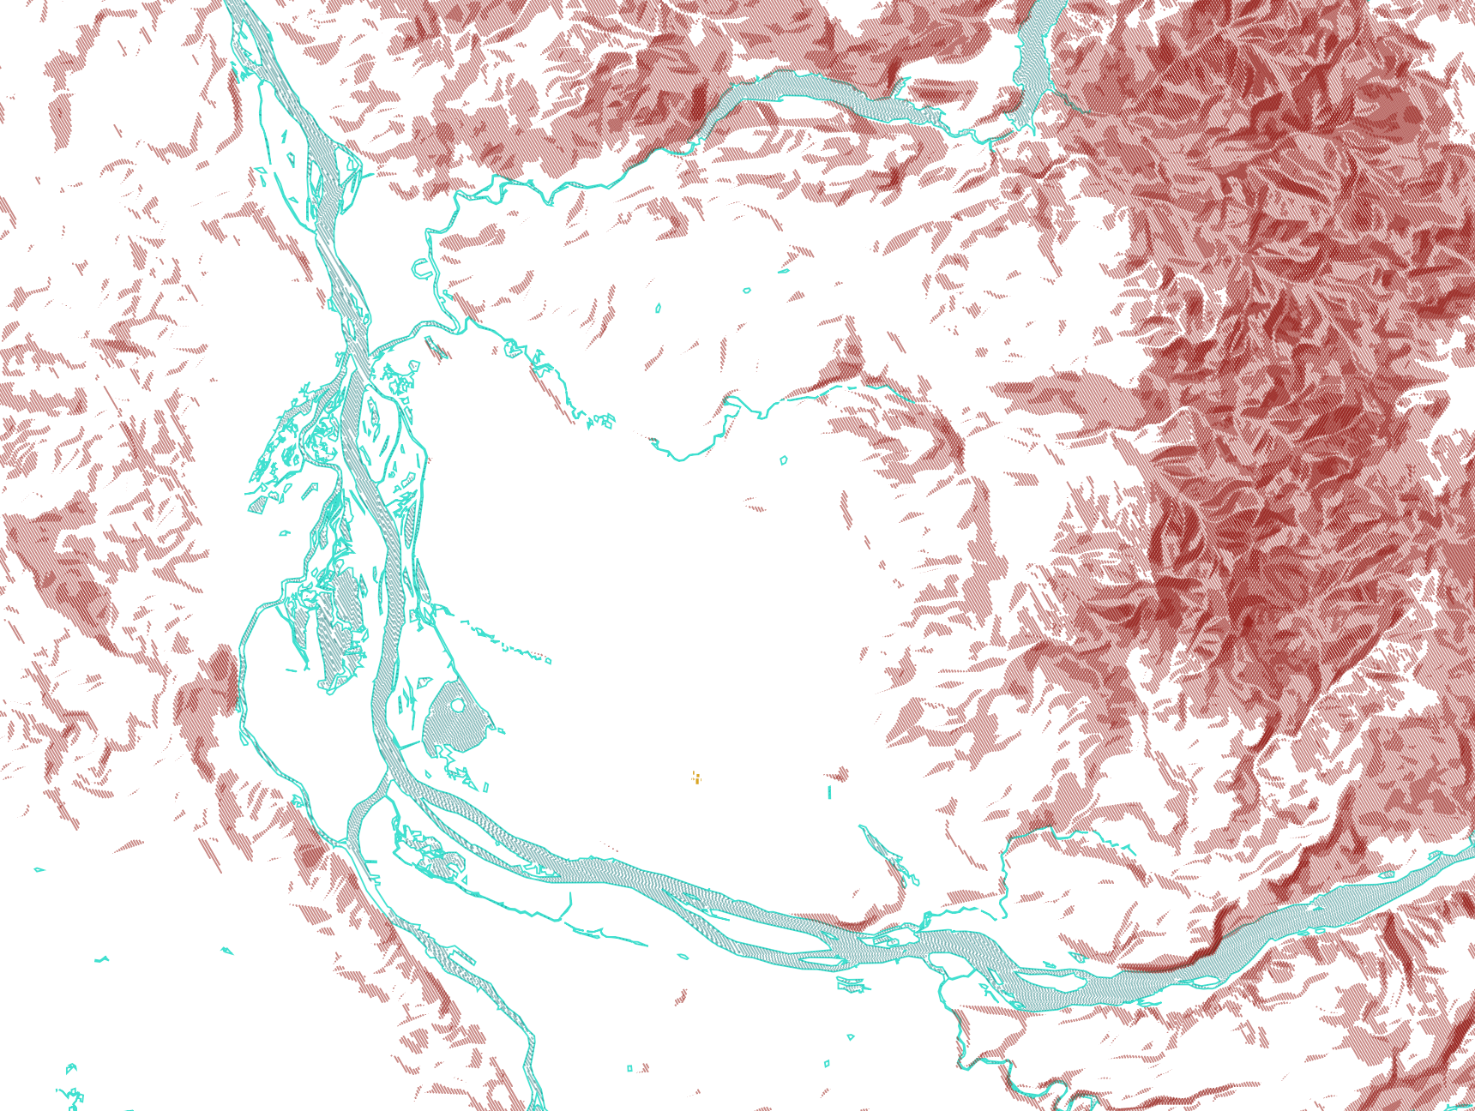
Made a cronchy hillshade drawing on the plotter today
https://observablehq.com/@lifewinning/cleaned-up-hillshade-generator sort of a hack but here is the cross-hatched hillshade map visualizations with cross-hatch bodies of water--because of the particular complexity of the river I'm using as an example I tesselate the water polygons but in theory you might not have to for a basic shoreline or something. Also yes, it loads super-slow sorry
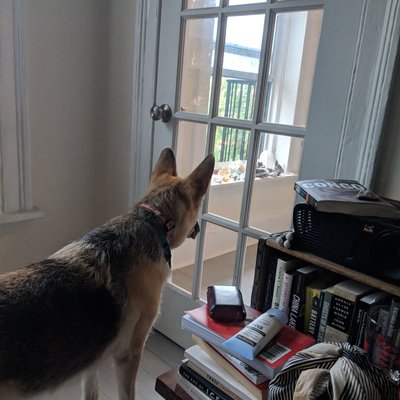
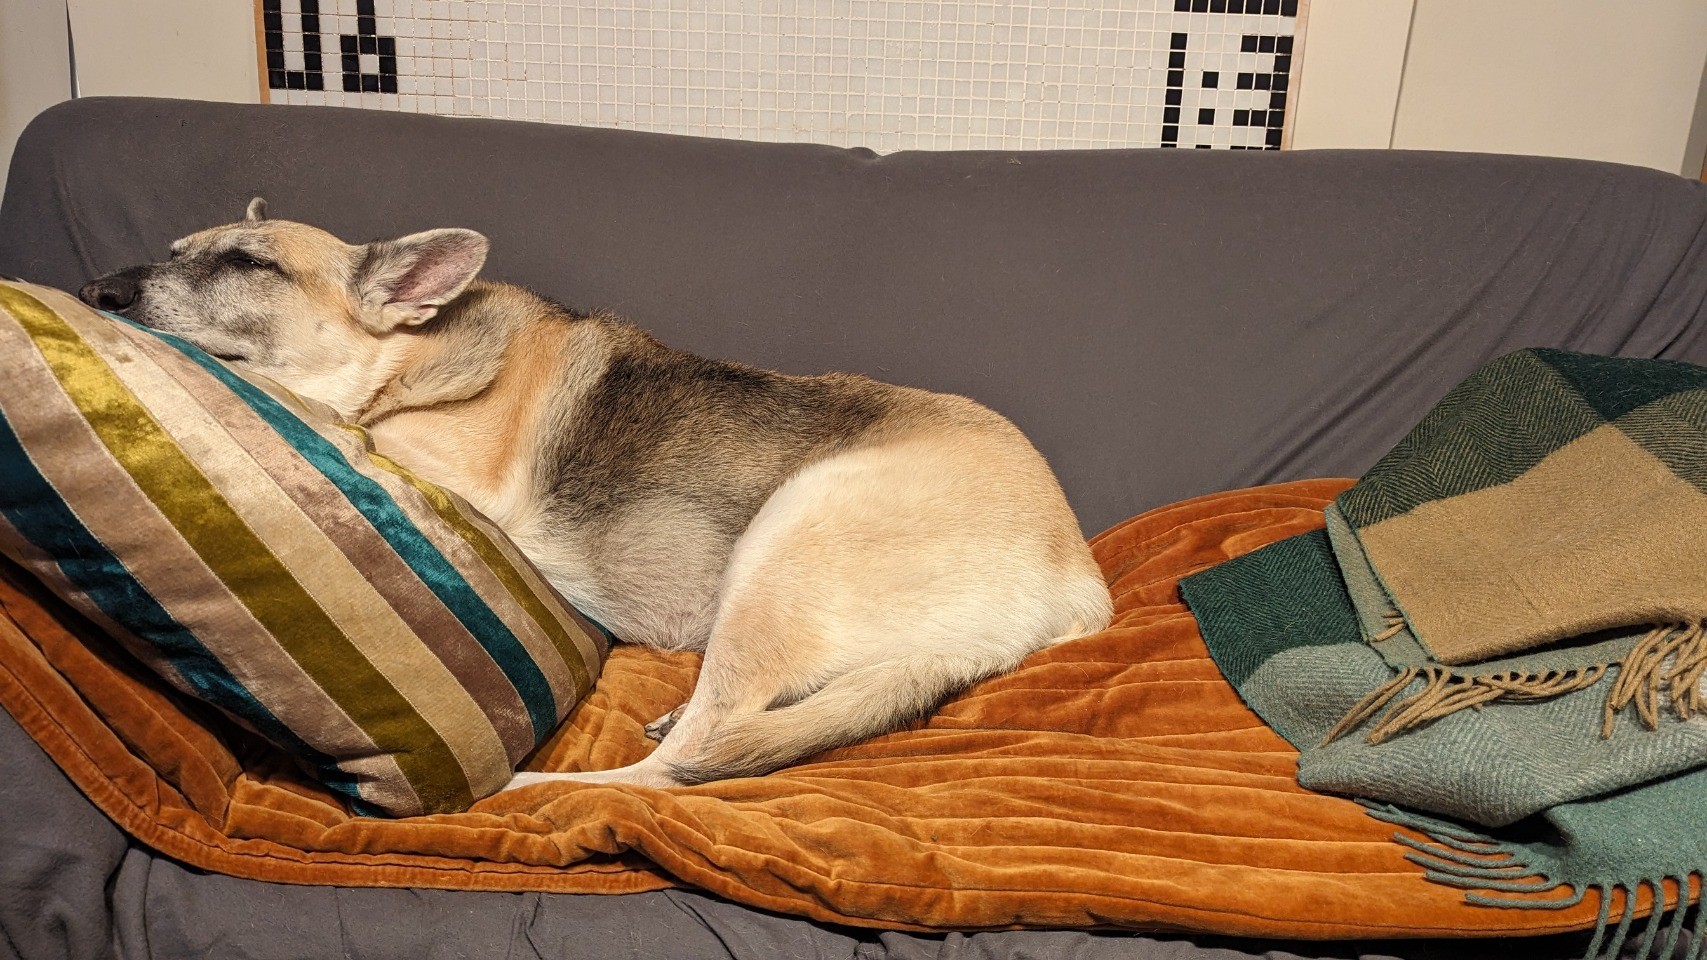
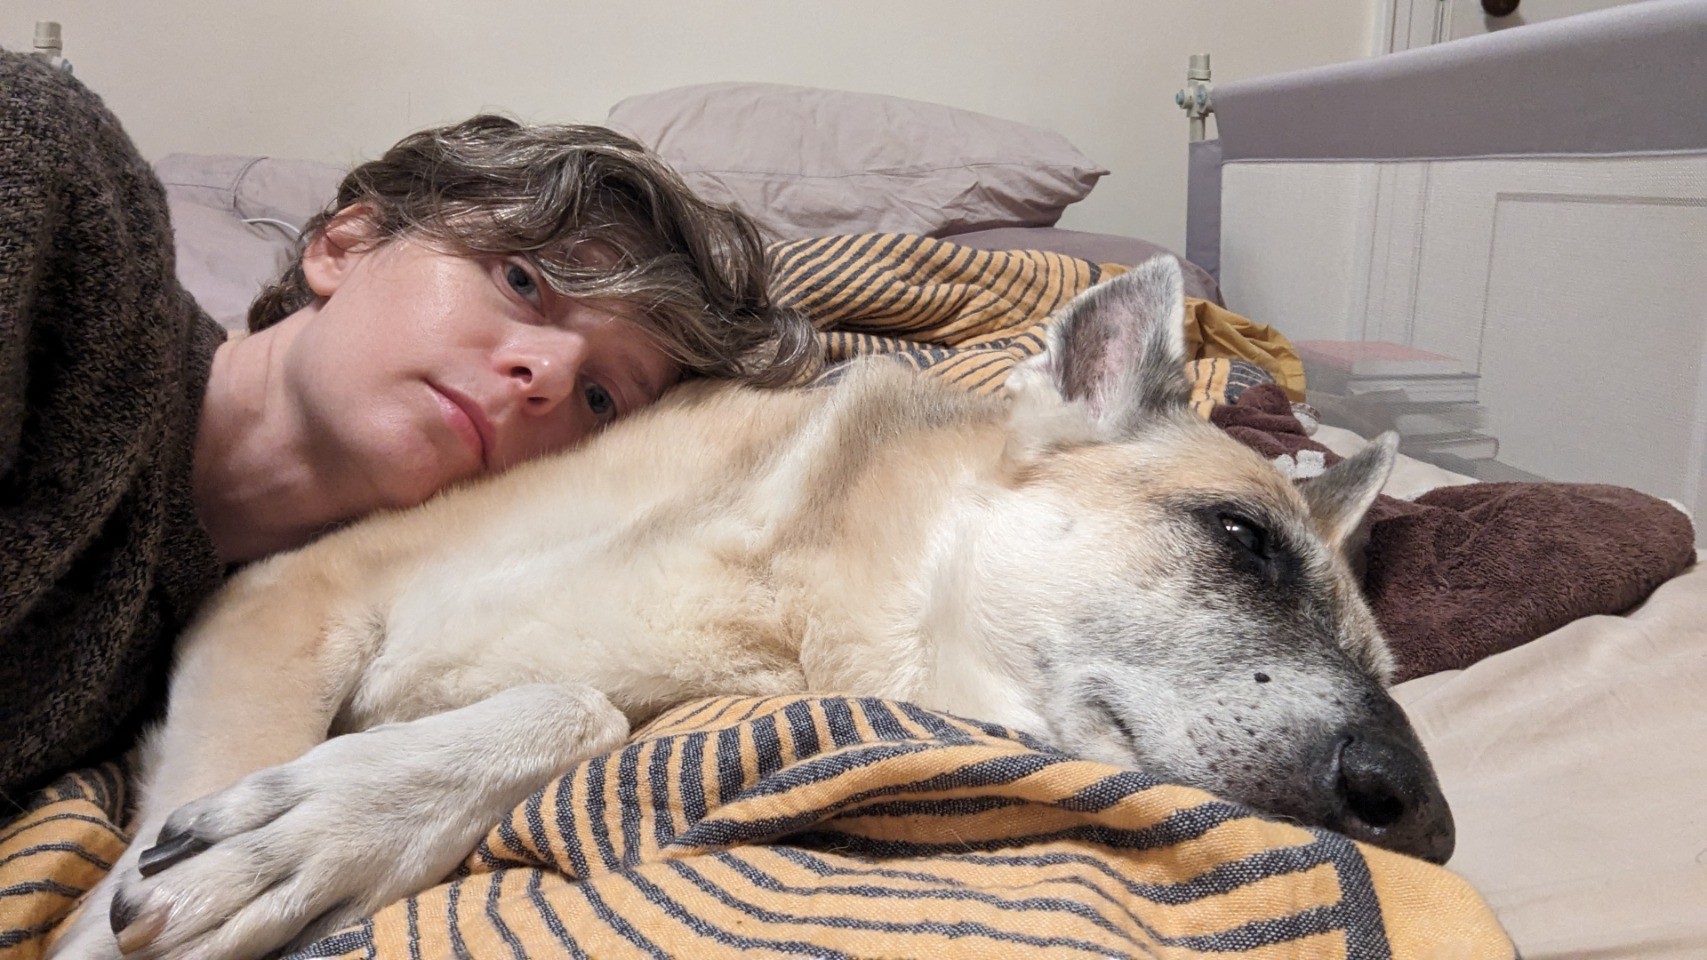
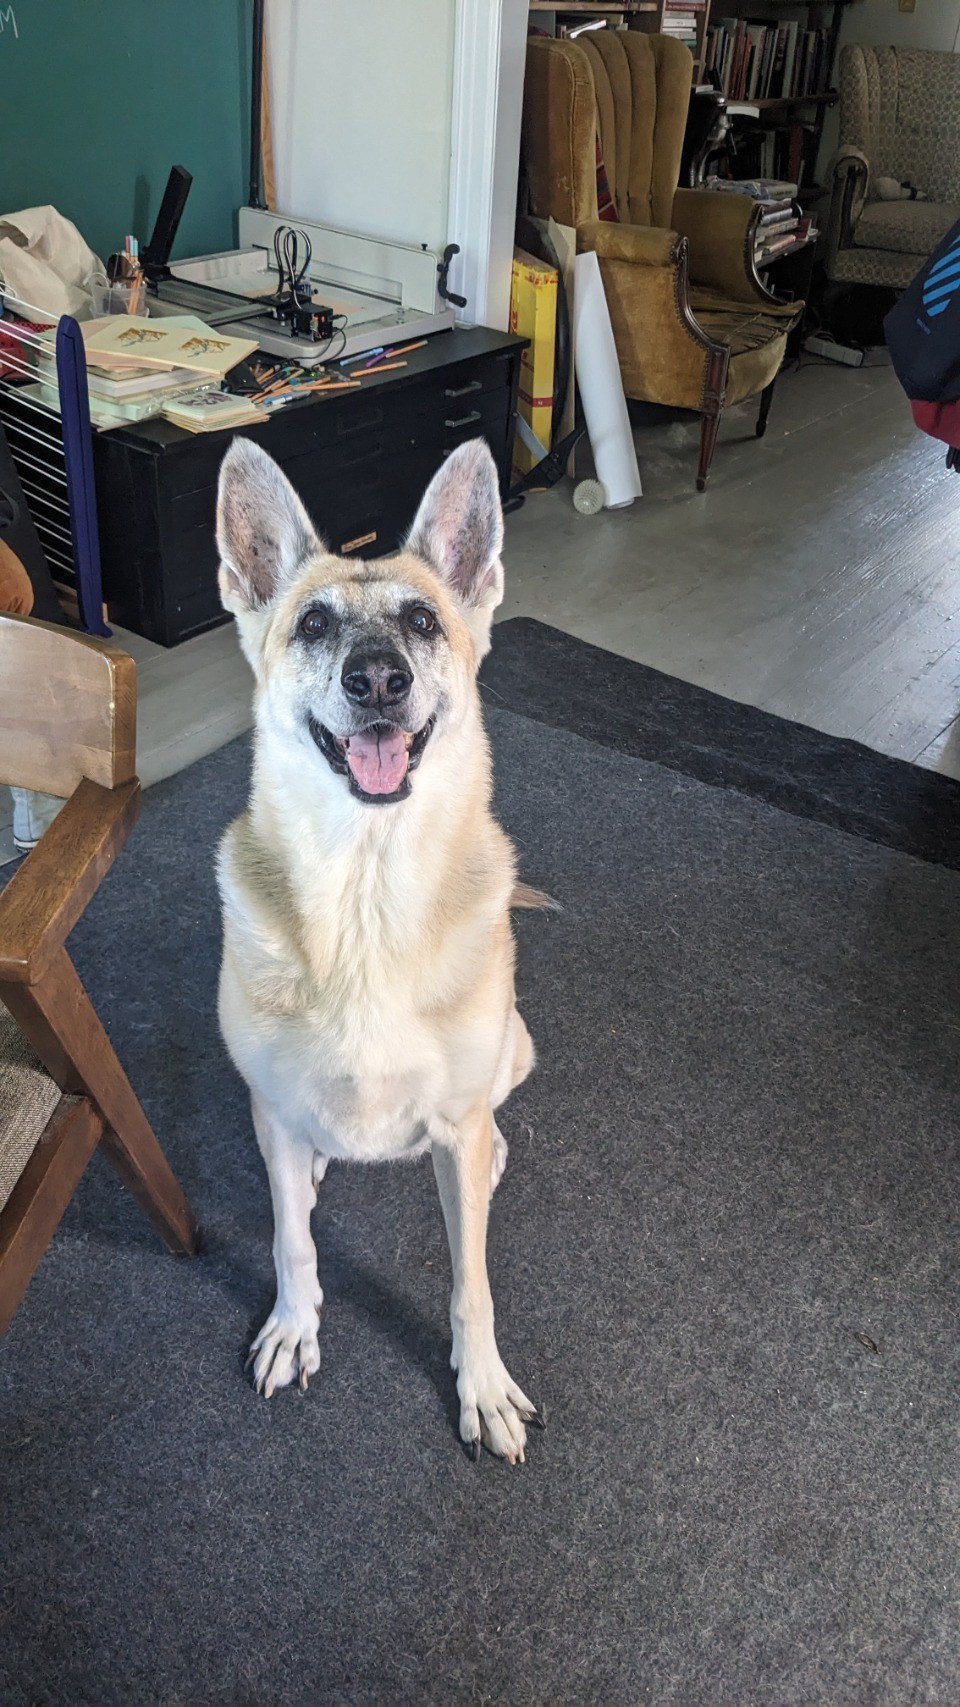
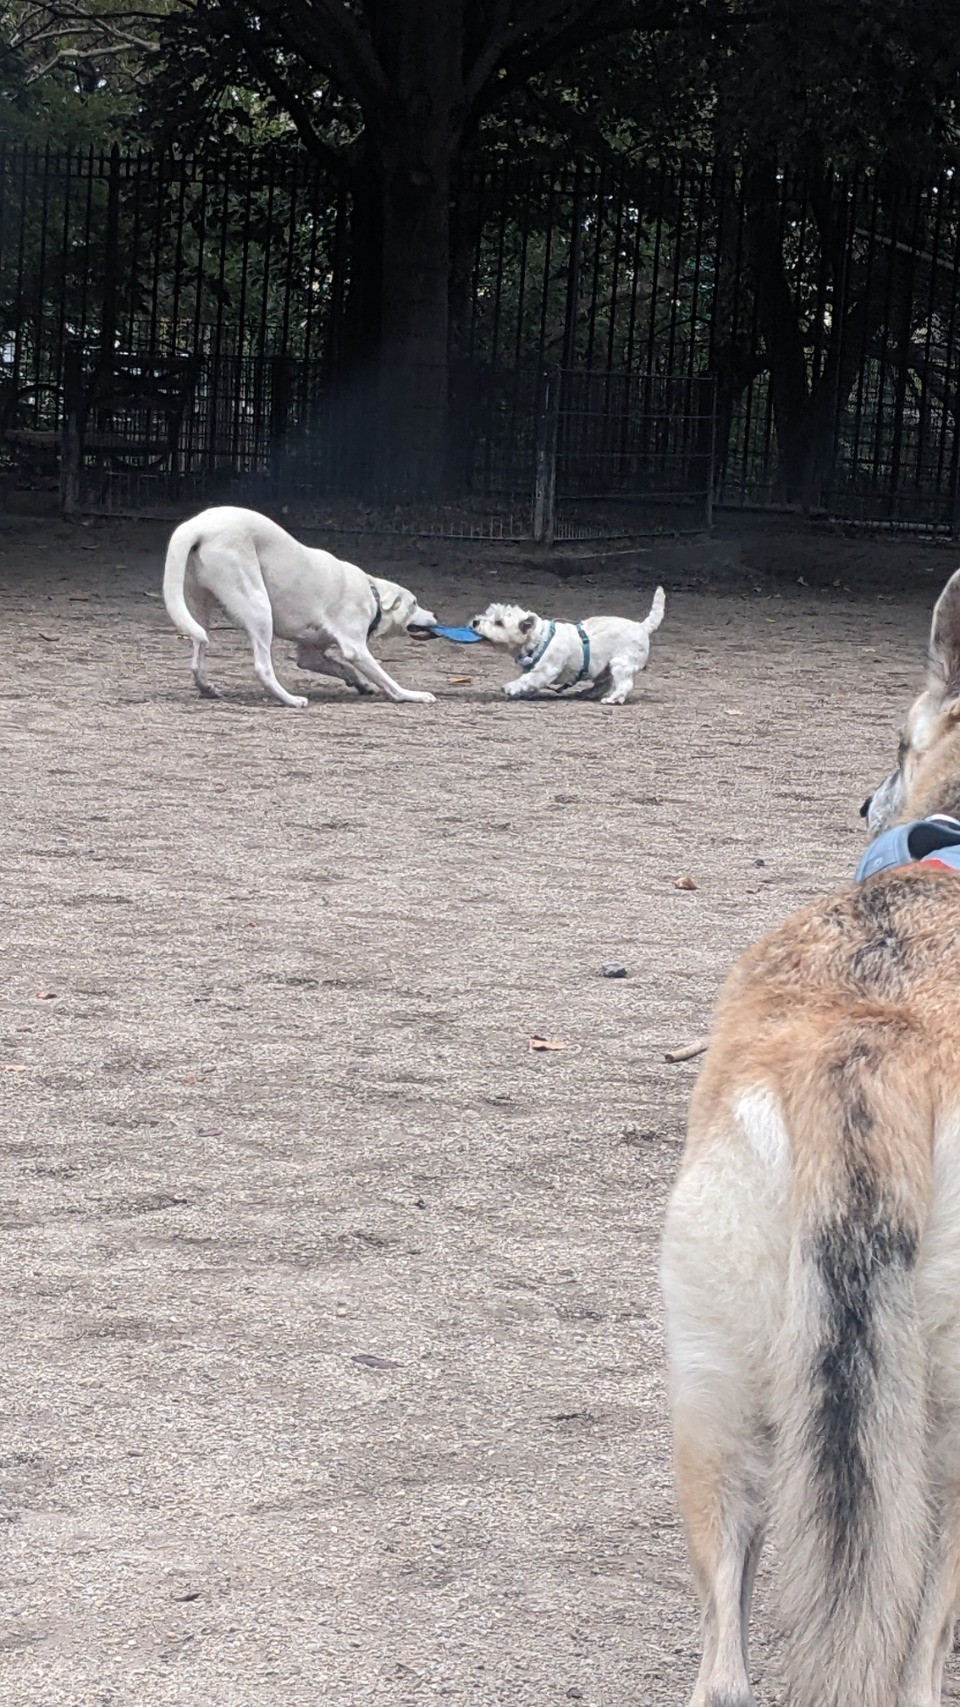
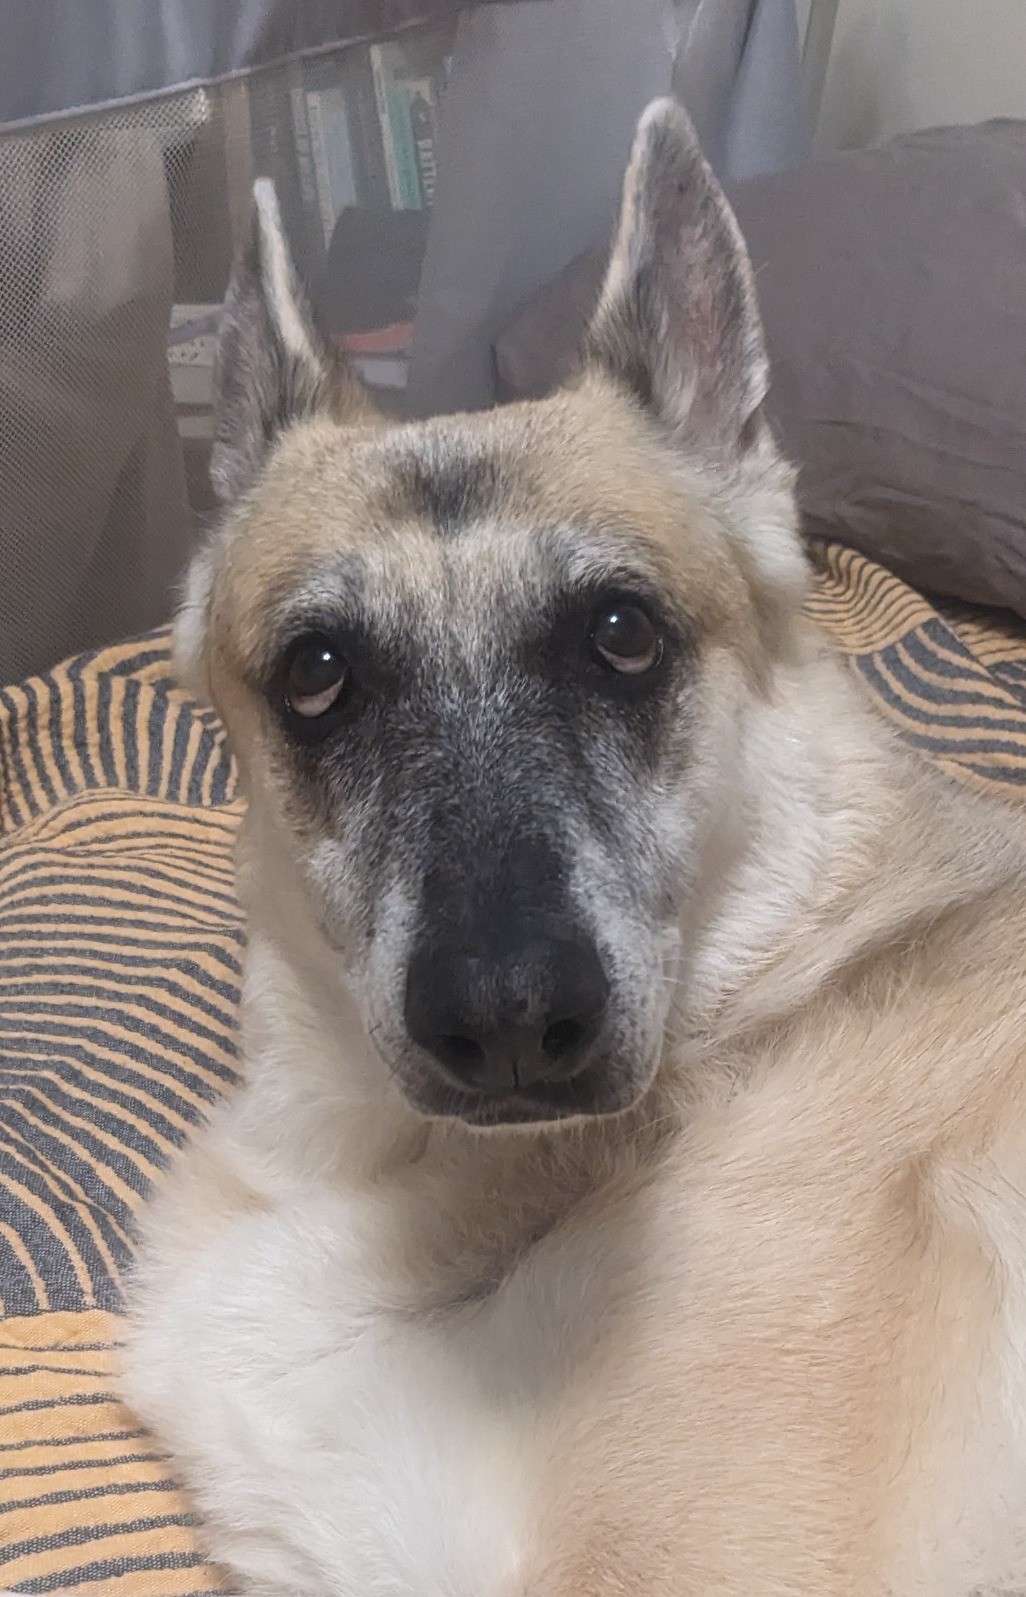
One time at the dog park someone said Kitty had "gravitas" and every time she does a goofy little face I whisper "gravitas" to her
- pronouns
- any
- web page
- http://lifewinning.com
- a little newsletter
- https://buttondown.email/perfectsentences
Admin
Joined Sep 2020