
Charlie Loyd @vruba@everything.happens.horse
- charlie@planet.parts
- work
- geographical pixels
- where
- Xučyun/Oakland, Ohlone land, western Laurentian accretions
- who
- him
You know him on the internet. Eucalypt-adjacent; very occasional writer. Consulting and passively looking for work in geospatial, image processing, and related fields.
Joined Apr 2022
WebP has flaws as a format – don’t we all – but I think the commentary should be putting more blame on (1) the industry’s failure to standardize on (and rigorously reviews the implementations of) a single JPEG successor format, given the obvious hunger, and (2) the practice of implementing anything that reads nontrivial untrusted data in a programming language that is not memory-safe.
When people and ideas I thought were cool in 2015 turn out to be wrong or tiresome: Everything changes. I have grown since then; also, some things that were once good are now bad.
When people or ideas I irrationally disliked in 2015 are now recognized as bad: I was right all along, as I always am.
Charlie Loyd
boosted

Une chronophotographie du 59e vol de l'hélicoptère martien #Ingenuity 🚁 qui permet de bien se rendre compte des différents paliers atteints : 5 en montée, 3 en descente, avec une altitude max (et record) de 20 m.
Crédit : NASA/JPL-Caltech/ASU/DejaSu #Mars #MarsHelicopter
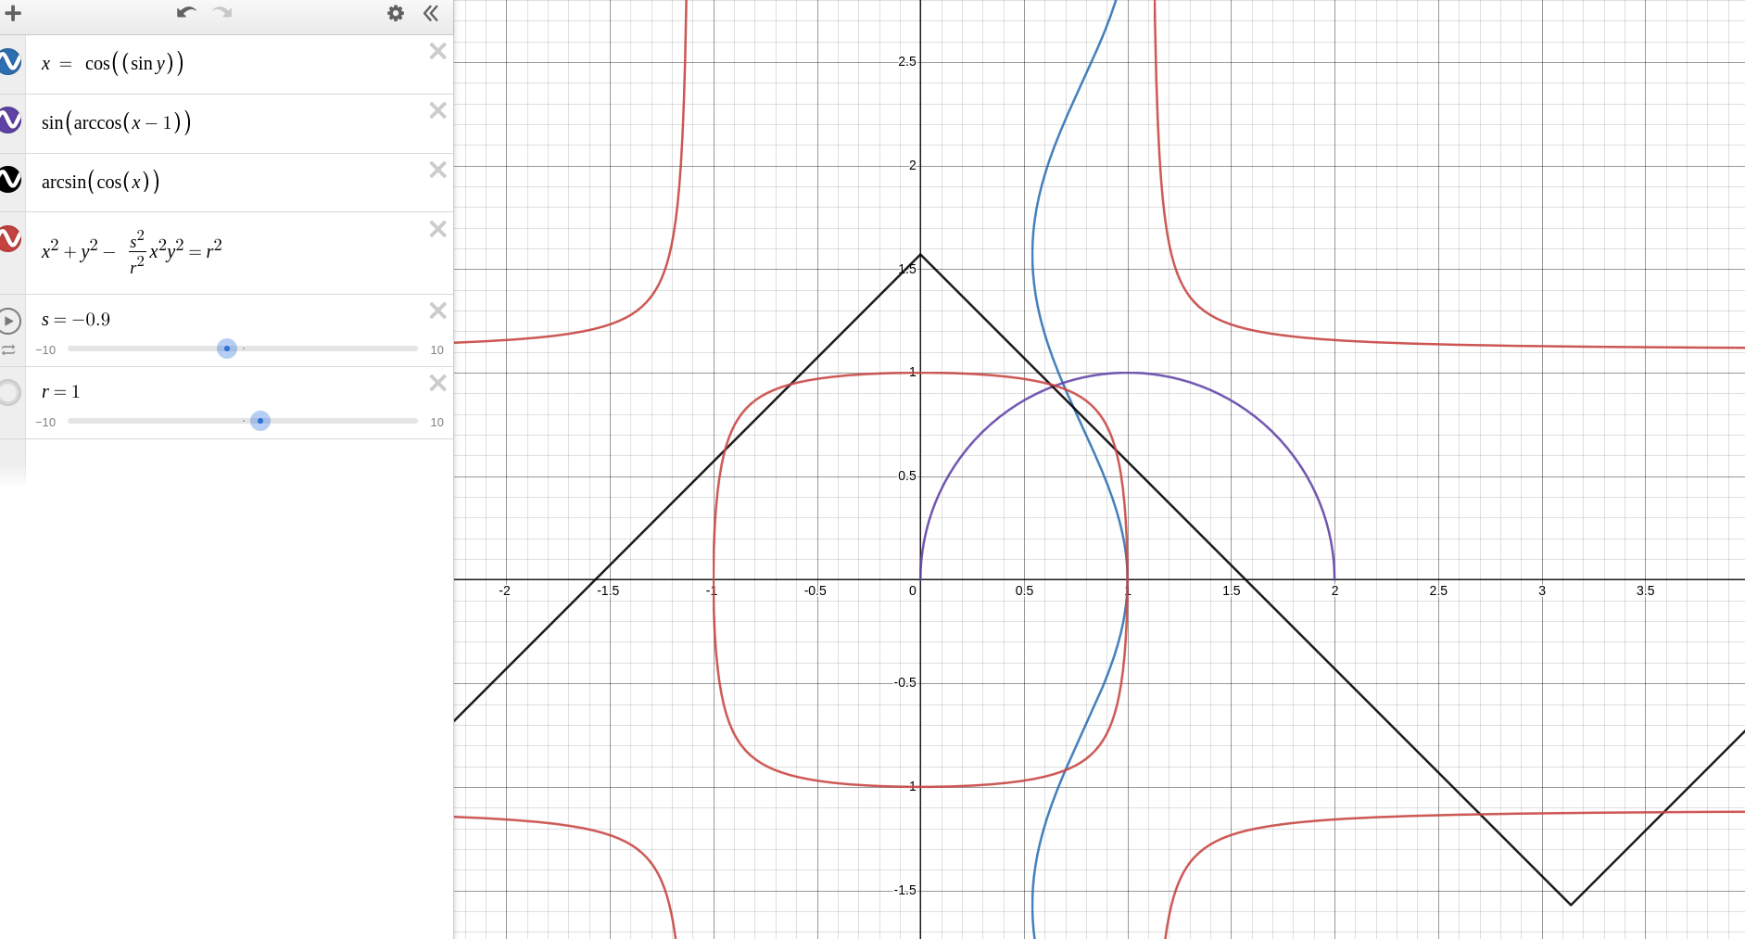
Gently closing the Desmos tab where I’ve been trying to build some kind of trigonometric intuitions about … ah … circles, maybe?
You ever think about how we have the both-sides view of a lot of important personal correspondences, even state-of-the-art-ly–encrypted correspondences, from like the early modern era and such? Or like we have Pepys’s diary, which (if I recall) he assumed that only he could read? It comes to mind a lot when I write a personal e-mail or make a new notes.md or whatever.
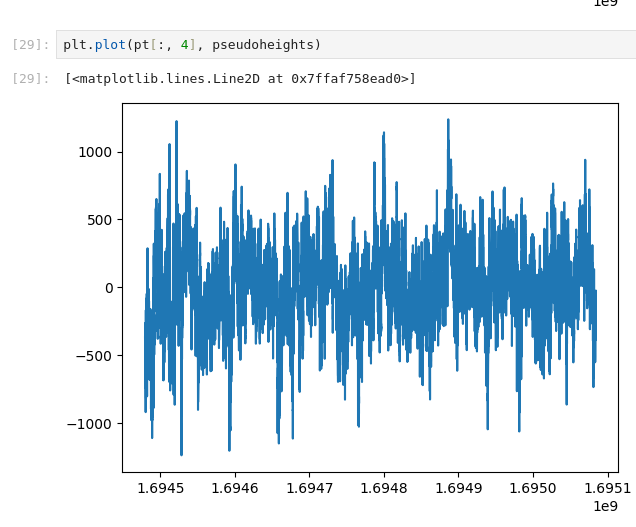
Lots of tinkering left to do on both the hardware and software sides, but I think my indoor GNSS setup is already picking up tidal signals on its test run.
Having worked around some very good programmers over the years (@sgillies, for example) means that sometimes when I write unwise code there’s a little voice saying “Wait, do it the better way! Save yourself the pain!” and I ignore it.
A freshly popular thing seems to be “I tried one X (film, meal, biography, …) from every country in the world!” and that’s cool in some ways, but in other ways, please stop reifying or familiarizing or practicing the country as the natural unit of humanity.
Charlie Loyd
boosted

Okay, fine, @jonty cajoled me into it. Lighter is more traffic; warmer is more positive anomaly for the day.
Now, certain nerds and haters might squint at this and say “It looks like you did this in oklab color space and then tried to half-ass some gamut mapping when you remembered that a lot of the highest z scores are in places with very low traffic counts!” and I would rebut that in scrupulous detail with one simple argument: Good night.
When math looks like this, with a lot of sub- and superscripts, it’s in tHe SpOnGeBoB mOcKiNg VoIcE.
Ideally you’d have this over a basemap and with both dimensions (number of views and view anomaly) visible, but I will generously allow someone else to worry about that.
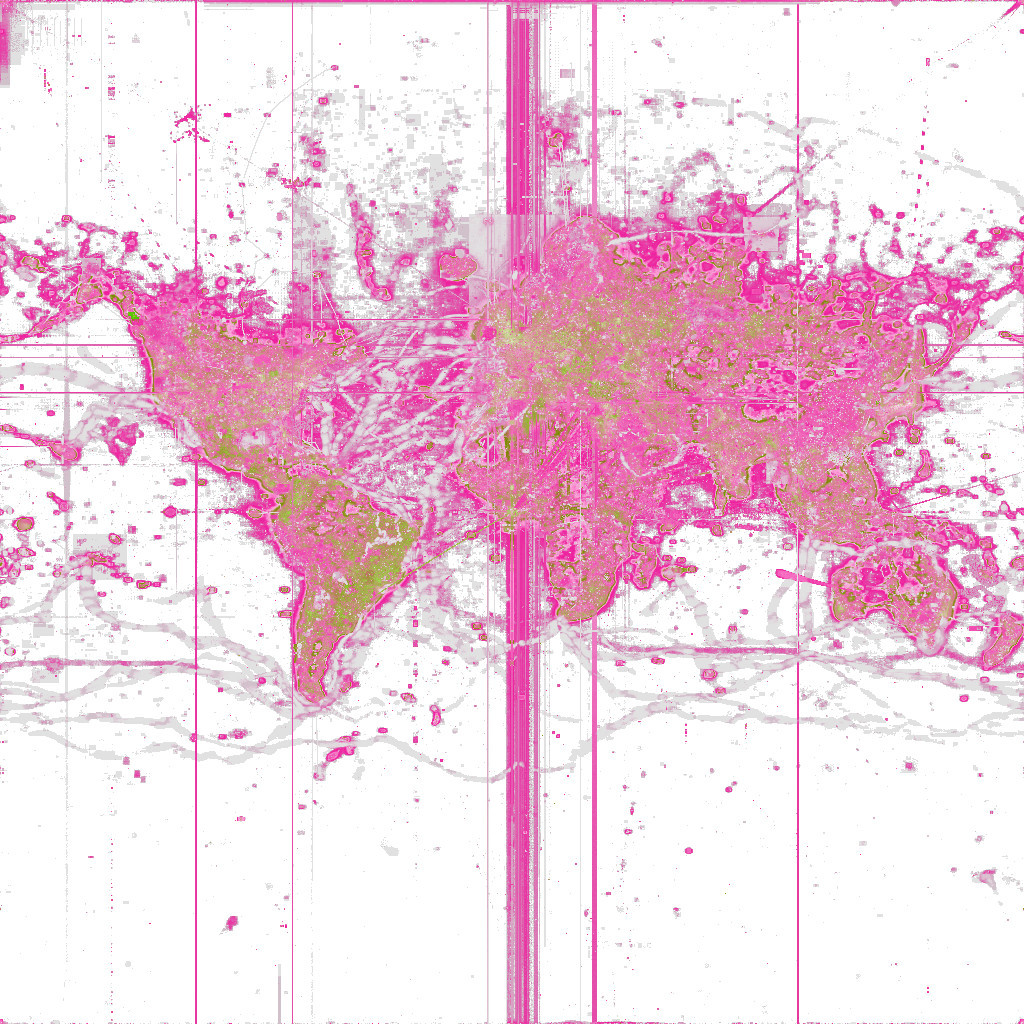
Same general idea and source data, but this time it’s just z-score (https://en.wikipedia.org/wiki/Standard_score), with red positive and green negative. Hard to say that this makes it easier to spot the interesting anomalies, but it seemed like the common sense thing to try. You can see the the OceanGate incident, the earthquake in Turkey and Syria, probably some festivals, etc.
Woops, the tag didn’t work in the original post. Credit to @pnorman for the idea.
The answers to your questions are:
1. Yacht and rally car races.
2. Yes, well noticed! We call it “Null Island”.
3. No, but it would be nice if it were practical.
4. People scraping tiles.
5. Yes, because the distribution of traffic follows Zipf’s law.
6. If I have time.
Inspired by @pnorman’s animation, here’s a year of daily OpenStreetMap tile traffic. One frame per UTC day, from the start of September 2022 through end of August 2023. It’s from the public log aggregates, so some low-traffic tiles are left out for (I assume) efficiency and privacy.
Charlie Loyd
boosted

#OpenStreetMap Standard Layer tile views for August 2023 - zoom 10 and above, 1 second = 15 hours
The amount of high-quality open data in these releases is amazing, and it’s been consistently timely.
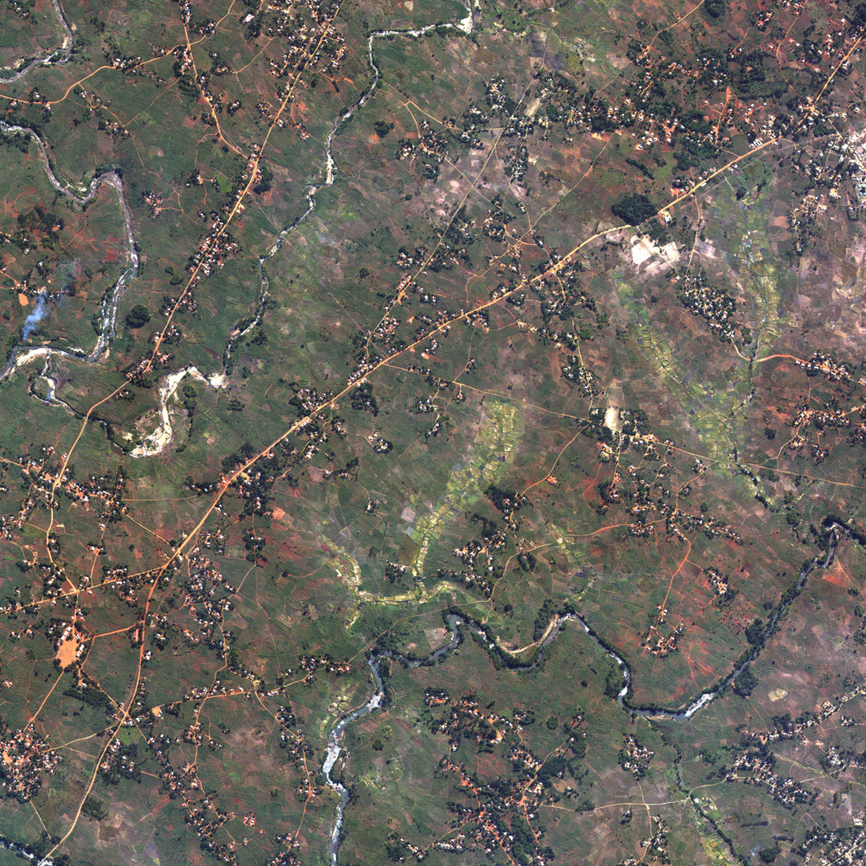
If I were doing disaster response work at the moment, I would be building heavily on this data.
Hard to think of another company giving out this much top-tier product, under CC-BY-NC and with no sign-up, just to help with disasters.
- charlie@planet.parts
- work
- geographical pixels
- where
- Xučyun/Oakland, Ohlone land, western Laurentian accretions
- who
- him
You know him on the internet. Eucalypt-adjacent; very occasional writer. Consulting and passively looking for work in geospatial, image processing, and related fields.
Joined Apr 2022